Trending Ideas – Will SABIC Sail Through Rough Waters?

Summary
- Saudi Basic Industries Corporation’s (SABIC) wide product portfolio, economies of scale and diversified geographical mix to help steer performance through the challenging markets
- Slow demand recovery, increased feedstock cost and lower product prices would lower FY 2016 earnings, however improvement is expected from FY 2017 onwards on anticipated oil price recovery and cost saving from efficiency improvement initiatives
- The increase in the petrochemical feedstock prices will impact Saudi companies’ competitive advantage, however ethylene production cost of Saudi ethane-fed cracker is still lowest globally, which will favor SABIC
- Though the long term growth story is attractive, the stock looks relatively little expensive at 2016 PE of ~19.5x v/s the industry average of ~16.71x, thus offering limited upside potential
- Despite an anticipated decline in DPS in 2016 and 2017, the dividend yield of 5% and 6.4%, respectively, can make SABIC a ‘value-buy’ in these turbulent times
SABIC (Tadawul: 2010) (Bloomberg Ticker: SABIC AB equity)
SABIC’s petrochemical product offerings range from basic chemicals to polymers and specialty chemicals, further complemented by strong position in global fertilizer industry and Saudi steel industry. This coupled with Saudi production facilities’ access to low cost feedstock enabled SABIC to generate operating margins higher than its global peers historically. Its 2025 strategy, re-emphasizing the focus on R&D, aims to introduce innovation in product development and create differentiated solutions for target market segments. This is likely to enhance SABIC’s market competitiveness amid intensifying global challenges and changing demand dynamics.
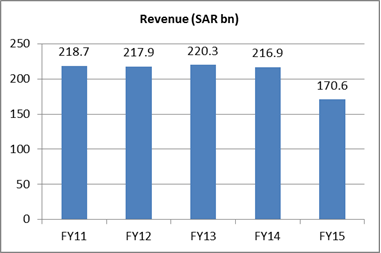
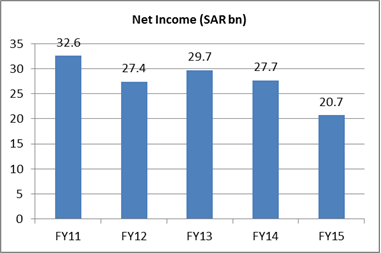
However, lowering of feedstock subsidies by Saudi government has eroded Saudi petrochemical companies’ profitability and competitive edge. Low product prices remain a key concern, until oil and commodity prices start showing revival. Sales volume growth is also expected to be muted due to ongoing weakness in global economic conditions. SABIC’s key end-markets are – Asia (33%), Middle East (24%), Europe (20%), America (10%), Africa (5%) and Others (8%). Therefore, FY 2016 net income will decline however is expected to recover thereafter as product prices starts bottoming out, efficiencies start improving and demand starts picking up.
In 2016, Saudi government increased prices of petrochemical feedstocks – methane and ethane from USD0.75/mmbtu to USD1.25/mmbtu and USD1.75/mmbtu, respectively. The discounts on NGLs were also lowered to 20% from 28%. SABIC expects feedstock cost hike to increase annual cost before minority interests by about 5%, this is relatively lower than the domestic peers who have higher reliance on natural gas feedstocks.
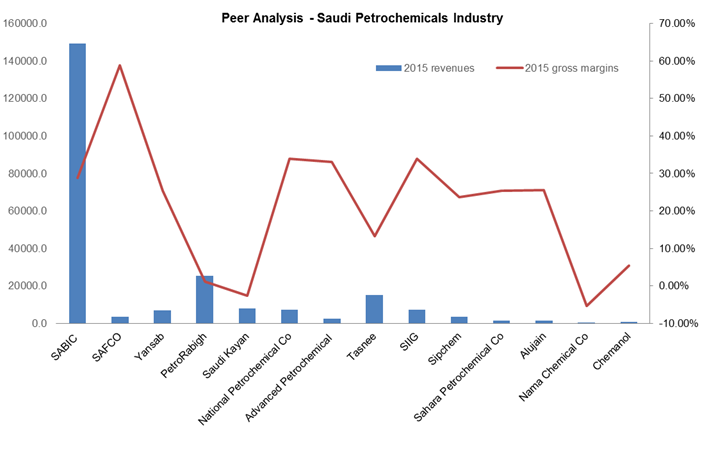
According to Gulf Petrochemicals and Chemicals Association (GPCA), GCC chemical industry generated total sales of USD87.4bn in 2014, growing at a CAGR of 8% during 2010-2014. Of the total sales, about 76% was accounted by Saudi Arabia. SABIC is the market leader in Saudi in terms of market capitalization, revenues and production capacity leveraging on it large and most diversified production base.
SAFCO enjoys the highest gross margins as this is a pure-play fertilizer major and sources natural gas feedstock at an attractive rate from Saudi Aramco. Petrorabigh is engaged in refining as well as downstream businesses which make earnings more susceptible to volatile refining margins. Amongst the worst performers are – Saudi Kayan which has been reporting losses since inception (2011), while Tasnee’s bottom line turned red first time post 2008-2009 financial crisis due to weak product prices and additional expenses related to restructuring activities.
SABIC’s 2016E valuation multiples (P/E: ~19.5x and EV/EBITDA: 8.7x) indicates that the stock price is expensive at current levels. Any correction in the stock price offers a compelling buying opportunity. Though DPS is expected to decline, dividend yield still looks attractive at 5.0% and 6.4% in FY 2016 and FY 2017, respectively.
This article is authored by Girish Bhise (Founder & CEO of ValueAdd)
About The Author:
About Trending Ideas:
The objective of ‘Trending Ideas’ is to share & discuss various ideas and themes trending in the market. The articles published are based on independent assessment and are mostly backed by detailed research/ reports. Anyone interested in procuring report may send a request to info@valueadd-research.com. ValueAdd may share the research at its own discretion based on the scrutiny of the request.
For Research & Business Enquiries, please call +91 982 076 3536 or +1 646 499 5902 or drop us a line on info@valueadd-research.com, and we will be happy to help you.
Disclaimer
This article is an exclusive property of ValueAdd Research & Analytics Solutions (“ValueAdd”).
This document should not be considered as an investment advice or a recommendation, or an offer to sell or a solicitation to buy, or an endorsement or recommendation of any company.
The information has been compiled or arrived at from sources believed to be reliable and accurate at the time of this analysis and in good faith. ValueAdd makes no representation or warranty, express or implied as to, nor has it verified, the accuracy, completeness, correctness and authoritativeness of the information. Accordingly, ValueAdd accepts no liability for any direct or consequential loss or damage arising from (i) the use of this communication, (ii) reliance on any Information contained herein, (iii) any error, omission, or inaccuracy in any such Information, or (iv) any action resulting therefrom. Authorized recipients should verify the factual accuracy, assumptions, calculations, and completeness of the information.
This document should not be reproduced in any form or distributed (in whole or in part) to any third party without prior consent from ValueAdd.
Saudi Basic Industries Corporation’s (SABIC) wide product portfolio, economies of scale and diversified geographical mix to help steer performance through the challenging markets Slow demand recovery, increased feedstock cost and lower product prices would lower FY 2016 earnings, however improvement is expected from FY 2017 onwards on anticipated oil price recovery and cost saving from efficiency improvement initiatives The increase in the petrochemical feedstock prices will impact Saudi companies’ competitive advantage, however ethylene production cost of Saudi ethane-fed cracker is still lowest globally, which will favor SABIC Though the long term growth story is attractive, the stock looks relatively little expensive at 2016 PE of ~19.5x v/s the industry average of ~16.71x, thus offering limited upside potential Despite an anticipated decline in DPS in 2016 and 2017, the dividend yield of 5% and 6.4%, respectively, can make SABIC a ‘value-buy’ in these turbulent times SABIC (Tadawul: 2010) (Bloomberg Ticker: SABIC AB equity)
SABIC’s petrochemical product offerings range from basic chemicals to polymers and specialty chemicals, further complemented by strong position in global fertilizer industry and Saudi steel industry. This coupled with Saudi production facilities’ access to low cost feedstock enabled SABIC to generate operating margins higher than its global peers historically. Its 2025 strategy, re-emphasizing the focus on R&D, aims to introduce innovation in product development and create differentiated solutions for target market segments. This is likely to enhance SABIC’s market competitiveness amid intensifying global challenges and changing demand dynamics.
However, lowering of feedstock subsidies by Saudi government has eroded Saudi petrochemical companies’ profitability and competitive edge. Low product prices remain a key concern, until oil and commodity prices start showing revival. Sales volume growth is also expected to be muted due to ongoing weakness in global economic conditions. SABIC’s key end-markets are – Asia (33%), Middle East (24%), Europe (20%), America (10%), Africa (5%) and Others (8%). Therefore, FY 2016 net income will decline however is expected to recover thereafter as product prices starts bottoming out, efficiencies start improving and demand starts picking up.
trending ideas2trending ideas3
In 2016, Saudi government increased prices of petrochemical feedstocks – methane and ethane from USD0.75/mmbtu to USD1.25/mmbtu and USD1.75/mmbtu, respectively. The discounts on NGLs were also lowered to 20% from 28%. SABIC expects feedstock cost hike to increase annual cost before minority interests by about 5%, this is relatively lower than the domestic peers who have higher reliance on natural gas feedstocks.
According to Gulf Petrochemicals and Chemicals Association (GPCA), GCC chemical industry generated total sales of USD87.4bn in 2014, growing at a CAGR of 8% during 2010-2014. Of the total sales, about 76% was accounted by Saudi Arabia. SABIC is the market leader in Saudi in terms of market capitalization, revenues and production capacity leveraging on it large and most diversified production base.
SAFCO enjoys the highest gross margins as this is a pure-play fertilizer major and sources natural gas feedstock at an attractive rate from Saudi Aramco. Petrorabigh is engaged in refining as well as downstream businesses which make earnings more susceptible to volatile refining margins. Amongst the worst performers are – Saudi Kayan which has been reporting losses since inception (2011), while Tasnee’s bottom line turned red first time post 2008-2009 financial crisis due to weak product prices and additional expenses related to restructuring activities.
trending ideas1
SABIC’s 2016E valuation multiples (P/E: ~19.5x and EV/EBITDA: 8.7x) indicates that the stock price is expensive at current levels. Any correction in the stock price offers a compelling buying opportunity. Though DPS is expected to decline, dividend yield still looks attractive at 5.0% and 6.4% in FY 2016 and FY 2017, respectively.
This article is authored by Girish Bhise (Founder & CEO of ValueAdd) About The Author: Girish has over 15 years of research experience across investment banking, equity research, fixed income and credit research, and business strategy research for large global clients including asset management firms, investment banks, brokerage firms, corporations, private equity & venture capital firms. Has extensive experience in successfully managing large-scale research right-shoring transitions across multiple regions. Is a thought-leader in the global research & technology industry. He is an MBA with specialization in Finance from the University of Pune, and Bachelor in Commerce from the University of Mumbai.
Please share your feedback/comments/thoughts on girish.bhise@valueadd-research.com. Thank you for time.
About Trending Ideas:
The objective of ‘Trending Ideas’ is to share & discuss various ideas and themes trending in the market. The articles published are based on independent assessment and are mostly backed by detailed research/ reports. Anyone interested in procuring report may send a request to info@valueadd-research.com. ValueAdd may share the research at its own discretion based on the scrutiny of the request.
For Research & Business Enquiries, please call +91 982 076 3536 or +1 646 499 5902 or drop us a line on info@valueadd-research.com, and we will be happy to help you.
Disclaimer
This article is an exclusive property of ValueAdd Research & Analytics Solutions (“ValueAdd”).
This document should not be considered as an investment advice or a recommendation, or an offer to sell or a solicitation to buy, or an endorsement or recommendation of any company.
The information has been compiled or arrived at from sources believed to be reliable and accurate at the time of this analysis and in good faith. ValueAdd makes no representation or warranty, express or implied as to, nor has it verified, the accuracy, completeness, correctness and authoritativeness of the information. Accordingly, ValueAdd accepts no liability for any direct or consequential loss or damage arising from (i) the use of this communication, (ii) reliance on any Information contained herein, (iii) any error, omission, or inaccuracy in any such Information, or (iv) any action resulting therefrom. Authorized recipients should verify the factual accuracy, assumptions, calculations, and completeness of the information.
This document should not be reproduced in any form or distributed (in whole or in part) to any third party without prior consent from ValueAdd.